
Dennis Rodman Is Our Pick for the NBA’s Best Rebounder of All Time
Dennis Rodman gets our era-aware vote. Compare his rebound rates with Wilt Chamberlain’s records, Bill Russell, Moses Malone and Andre Drummond.
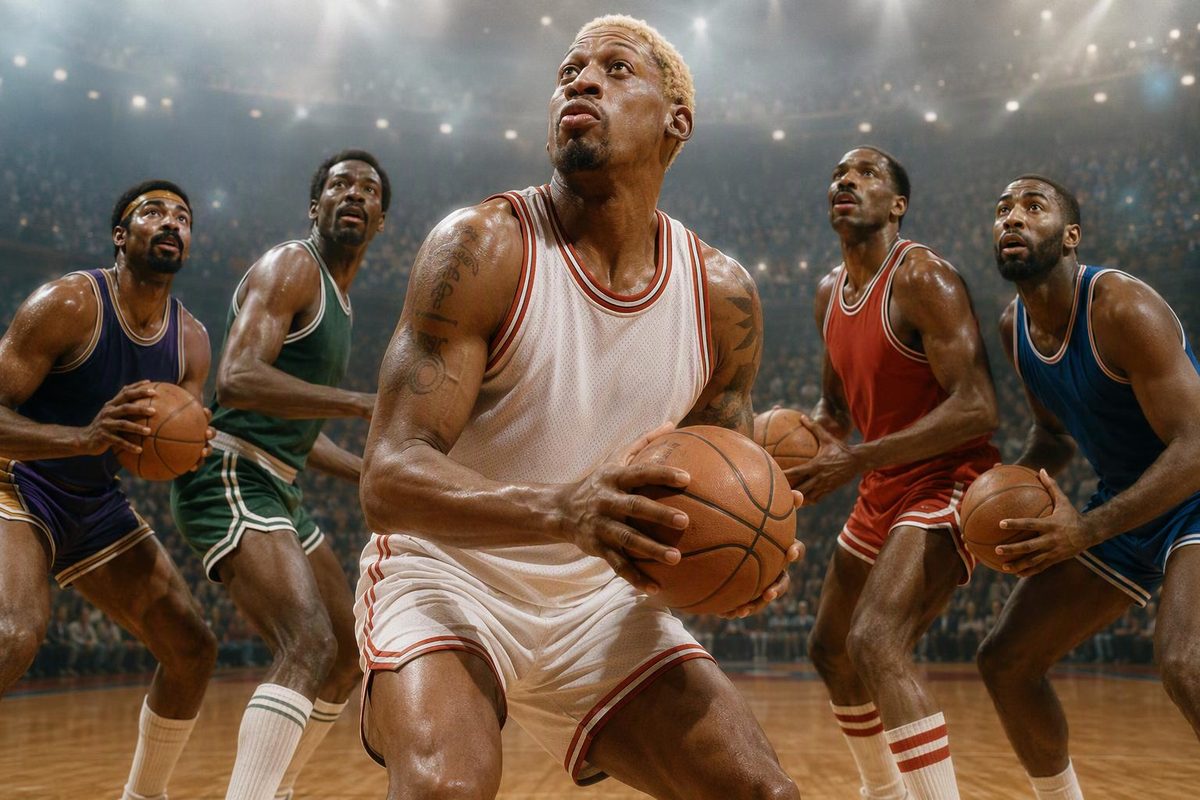
Dennis Rodman is our pick for the best rebounder in NBA history, weighting sustained peak performance, the share of available rebounds collected and excellence in both offensive and defensive rebounding. That is an editorial judgment, not an official statistical title. Wilt Chamberlain is the career rebound record-holder, with 23,924 NBA regular-season rebounds. Chamberlain’s NBA profile
The distinction matters because rebounds per game depend on opportunity: minutes played, shot volume and how often those shots miss. A player cannot rebound a made basket, and a slower game usually offers fewer chances.
Here, “best” means rebounding ability—not the best overall player among great rebounders. The comparison is limited to the NBA, with regular-season statistics unless otherwise noted.
Why Rodman gets the edge
Rodman led the NBA in rebounds per game for seven consecutive seasons, from 1991–92 through 1997–98, doing so across Detroit, San Antonio and Chicago. The Basketball Hall of Fame identifies that streak as a record. Sustaining the lead across different teams strengthens his case beyond one exceptional season or one favorable lineup. Hall of Fame profile
His highest rebounding average came in 1991–92: 18.7 rebounds in 40.3 minutes per game, across all 82 games. That included 6.4 offensive rebounds and 12.3 defensive rebounds per game. He was recovering his own team’s misses as well as finishing opponents’ possessions. Rodman’s season statistics
The more useful comparison tool is total rebound percentage, or TRB%: an estimate of the percentage of available rebounds a player collected while on the floor. Unlike rebounds per game, it accounts for playing time and the team-and-opponent rebound pool. It is not the percentage of his own team’s rebounds. Because it uses box-score totals and minutes rather than tracking each opportunity, it remains an estimate. Basketball-Reference definition and formula
Rodman’s 1994–95 season illustrates why the distinction matters. He averaged fewer rebounds—16.8—but his estimated TRB% rose to 29.7%, compared with 26.2% in 1991–92. His estimated share of available boards was larger despite the lower per-game total. That 1994–95 season covered only 49 games, so it belongs alongside his longer seasons, not above them automatically. Across his seven title seasons, his TRB% ranged from 24.1% to 29.7%. Rodman’s advanced and per-game statistics
The strongest alternative cases
These are different routes to the answer, not a ranking based on career totals alone.
| Player | Strongest argument | Important qualification |
|---|---|---|
| Dennis Rodman | Seven consecutive rebounding titles and an exceptional sustained peak | He does not lead the career-total or career-TRB% lists. |
| Wilt Chamberlain | 23,924 career rebounds, 11 rebounding titles and a 55-rebound game | His enormous totals came in a different shot-volume and playing-time environment. |
| Bill Russell | 21,620 career rebounds and a 22.5 career average | His career predates official offensive/defensive rebound splits. |
| Moses Malone | Six rebounding titles and 6,731 NBA offensive rebounds | The offensive-rebound record covers the era in which those rebounds were separately recorded. |
| Andre Drummond | A higher recorded career TRB% than Rodman | Career rate is one criterion, rather than a complete all-time verdict. |
Why not simply choose Wilt?
Chamberlain’s 11 rebounding titles are a powerful within-era argument. His records should not be dismissed merely because he played earlier.
But the shots behind the numbers differed substantially. In 1960–61, NBA teams averaged 109.4 field-goal attempts and 45.4 makes per game—about 64 missed field goals per team. In Rodman’s 1991–92 season, teams averaged 87.3 attempts and 41.3 makes—about 46 misses. Those figures are calculated by subtracting makes from attempts using the rounded league averages. They are not exact rebound-opportunity counts, but they show why raw averages are not directly interchangeable. Historical league averages
There is also a data limit: Basketball-Reference’s NBA TRB% coverage begins in 1970–71, missing most of Chamberlain’s career and all of Russell’s. Official offensive and defensive rebound splits began in 1973–74. Missing historical rates are not evidence that those players were inferior. Career TRB% coverage; NBA historical statistics context
What about Drummond’s higher rebound percentage?
As of October 31, 2026, Basketball-Reference’s NBA career leaderboard lists Drummond first at 24.99% and Rodman second at 23.44%. If your rule is simply “highest qualifying recorded career rebound percentage,” Drummond is the answer. Career TRB% leaderboard The site’s NBA career qualification minimum for this statistic is 15,000 minutes played. Rate-statistic requirements
That is a genuine challenge to Rodman’s case. TRB% adjusts for opportunity, but its formula does not identify contested rebounds, credit a teammate’s box-out or fully separate individual skill from role. We give Rodman the overall edge because we weight sustained peak dominance and repeated league-leading seasons more heavily than the career rate alone.
That rebounding judgment is different from counting how often a player reached double figures in two categories. For that separate question, see the NBA’s double-double leaders.